
The Golden Triangle area as defined by the DigiGeoData map is one of the most active areas for mineral exploration in Canada. This area is endowed with main economic minerals of copper, gold and silver and secondary economic minerals of molybdenum, lead and zinc.
The Golden Triangle currently has two producing mines; Red Chris and Brucejack and three proposed mine projects including Galore Creek, KSM and Red Mountain.
There are another 33 deposits with NI 43-101 compliant reserves and resources.
In October 2019, there were over 70 companies exploring in the area.
Copper Endowment
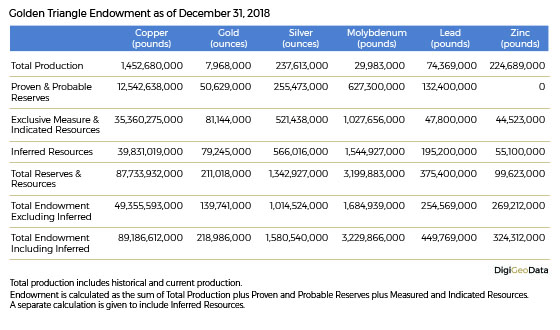
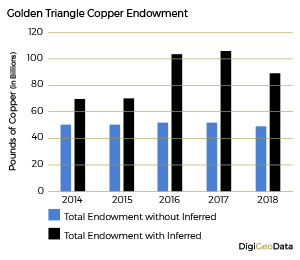
Total Copper endowment as of December 31, 2018 for the Golden Triangle area not including inferred resources is 49.4 billion pounds. Adding the inferred resources of 39.8 billion pounds, total endowment increases to 89.2 billion pounds of copper.
Prior to 2015, historical copper production was approximately 1.2 billion pounds. The most prolific mine was Hidden Creek producing over 709 million pounds before it closed in 1936. The last significant production was from the Granduc mine which closed in 1984 producing over 418 million pounds. Recent copper production of 280 million pounds from the Red Chris mine from 2015 to 2018, brings the total copper production for the area to close to 1.5 billion pounds.
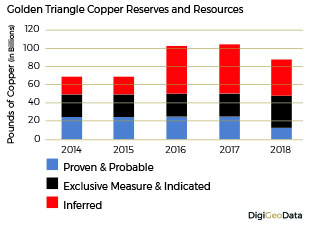 At the end of 2018, proven and probable copper reserves were calculated at close to 12.5 billion pounds which was half of the 25 billion pounds at the end of 2017. The reason for this was that in 2018, Teck re-stated the reserves and resources for both Schaft Creek and Galore Creek and excluded the proven and probable reserves.
In the same period, exclusive measured and indicated copper resources increased by 9.6 billion pounds (37%) largely due to an increase of 9.2 billion pounds at Galore Creek. Inferred resources decreased by 14 billion pounds (26%) largely due to re-stating of inferred resources at Iron Cap from 19.2 billion pounds down to 1.3 billion pounds.
Gold Endowment
Total Gold endowment as of December 31, 2018 for the Golden Triangle area not including inferred resources is 139.8 million ounces. Adding the inferred resources of 79.2 million ounces, total endowment increases to 219 million ounces of gold.
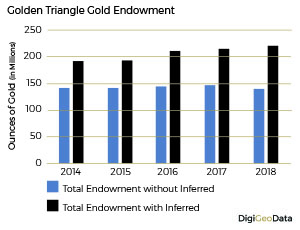
Prior to 2015, historical gold production was 7.3 million ounces. The 3 most significant past producing mines contributing to this production was the Premier mine with close to 2 million ounces, the Snip mine with just over 1 million ounces and Eskay Creek, the most productive past producer, with 3.3 million ounces. Recent gold production from 2015 to 2018 of 148,400 ounces from the Red Chris mine and 537,000 ounces from the Brucejack mine, combine to make total gold production for the area to almost 8 million ounces.
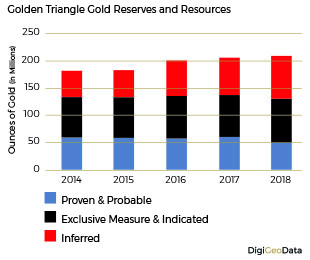
At the end of 2018, proven and probable gold reserves were calculated at just over 50.6 million ounces, which was 11.2 million ounces (22%) less than at the end of 2017. Like the copper reserves, in 2018, Teck re-stated the reserves and resources for both Schaft Creek and Galore Creek and excluded the proven and probable reserves.
In the same period, exclusive measured and indicated gold resources increased by 4.5 million ounces (6%) with the most influence due to an increase of 6.7 million ounces at Galore Creek. Inferred resources increased by close to 12 million ounces (15%) largely due to an increase of inferred resources at Iron Cap of 15 million ounces and a new inferred resource at Eskay Creek of just under 500,000 ounces.
Silver Endowment
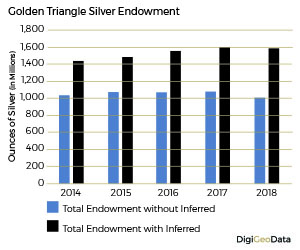
Total silver endowment as of December 31, 2018 for the Golden Triangle area not including inferred resources is approximately 1.01 billion ounces. Adding the inferred resources of 566 million ounces, total endowment increases to 1.58 billion ounces of silver.
Historical silver production prior to 2015 was 236.5 million ounces. The 3 most significant past producing mines contributing to this total was the Torbrit mine with over 18.6 million ounces, the Premier mine with 42.7 million ounces and Eskay Creek, the most productive past producer, with 158.8 million ounces.
Recent silver production from 2015 to 2018 of 522,600 ounces from the Red Chris mine and 601,800 ounces from the Brucejack mine combine to make total silver production for the area to 237.6 million ounces.

As of December 2018, proven and probable silver reserves were 255.5 million ounces, which was 154.9 million ounces (38%) less than at the end of 2017. Like the copper and gold reserves, in 2018 Teck re-stated the reserves and resources for both Schaft Creek and Galore Creek and excluded the proven and probable reserves of 153.9 million ounces.
In the same period, exclusive measured and indicated silver resources increased by 84.7 million ounces (19%) with the big contributor being Galore Creek with an increase of 116.3 million ounces. The largest decrease was Big Missouri with a decline of 11.2 million ounces.
Inferred resources increased by close to 39.3 million ounces (7%), with the most influence due to an increase of 94.8 million ounces at Iron Cap and 9.8 million ounces from an initial inferred resource at Eskay Creek. The two largest declines were Galore Creek by 30.8 million ounces and Schaft Creek by 20.4 million ounces.
Molybdenum Endowment
Other significant base metals being explored for in the Golden Triangle include molybdenum, lead and zinc.
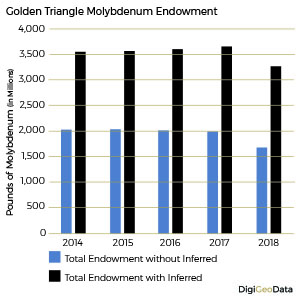
Total molybdenum endowment as of December 31, 2018 for the Golden Triangle area not including inferred resources is 1.7 billion pounds. Adding the inferred resources of 1.5 billion pounds increases the total endowment to 3.2 billion pounds of molybdenum.
Historical molybdenum production was closeto 30 million pounds. There has been no recent production.
By the end of 2018, proven and probable molybdenum reserves were calculated at 627.3 million pounds which was 373.3 million pounds less than at the end of 2017. This was due to a complete write down of molybdenum reserves at Schaft Creek by Teck.
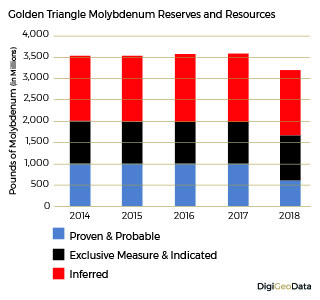
In the same period, exclusive measured and indicated molybdenum resources increased by 47 million pounds (5%) due to an increase of 19 million pounds at Schaft Creek and 28 million pounds at Iron Cap.
Inferred resources decreased by 56.6 million pounds (4%) largely due to decrease of inferred resources at Schaft Creek of 73.7 million pounds.
Lead Endowment
Total lead endowment as of December 31, 2018 for the Golden Triangle area not including inferred resources is 254.6 million pounds. Adding the inferred resources of 195.2 million pounds increases the total endowment to 449.8 million pounds of lead.
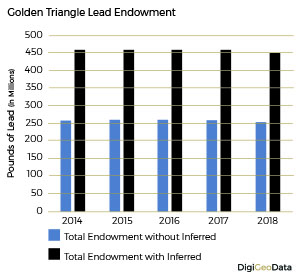
Historical lead production was 74.3 million pounds. There has been no recent production.
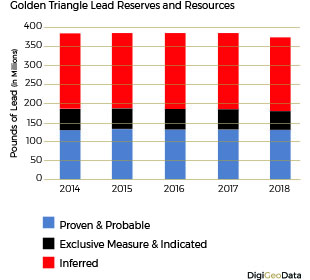
At the end of 2018, proven and probable lead reserves were calculated at 132.4 million pounds which remains unchanged over the past five years.
In the same period, exclusive measured and indicated lead resources decreased by 5.1 million pounds (10%) to 47.8 million pounds due to the removal of lead resources from Silver Coin. Inferred resources decreased by 5.3 million pounds (3%) to 195.2 million pounds due to the removal of lead resources from Silver Coin.
Zinc Endowment
Total zinc endowment as of December 31, 2018 for the Golden Triangle area not including inferred resources is 67 million pounds. Adding the inferred resources of 55.1 million pounds increases the total endowment to 122.1 million pounds of zinc.

Historical zinc production was 22.5 million pounds. There has been no recent production.
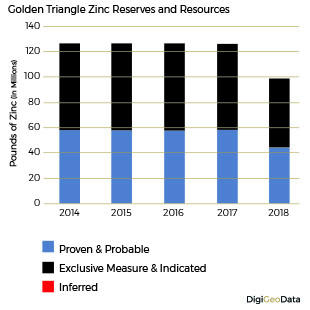
At the end of 2018, there were no proven and probable zinc reserves reported.
In the same period, exclusive measured and indicated zinc resources decreased by 13.6 million pounds (23%) to 44.5 million pounds due to the removal of zinc resources from Silver Coin in 2018. Inferred resources decreased by 5.3 million pounds (3%) to 195.2 million pounds due to the removal of lead resources from Silver Coin in 2018.